2 Data Types
2.1 Types of data
Broadly speaking, by data we mean numerical values associated with some variable of interest. Different types of data may need special treatment when it comes to statistical analysis. For this reason, it is important to be able to distinguish a few key features. A variable can produce data that are either of continuous or discrete nature (see below for examples).
Another level at which variables differ is whether they are sampled in time or in a cross-section.
2.1.1 Discrete data
The variable \(X\) is said to be discrete if it can only ever yield isolated values some of which (if not all) are often repeated in the sample. It is, however, important to note that there are different types of discrete data:
- ORDINAL. Here the categories have a natural ordering.
Examples: Football Leagues: Premier League, Championship, etc. - NOMINAL. Here there is no natural ordering to the categories.
Examples: Gender: Male, Female - COUNT. A variable that represents the counts of certain events.
Examples: Number of children in household: 0,1,2,3,etc.
Before moving on from here it is important to understand that the mere process of collecting data may not be an innocent or totally neutral process. For instance the above note on gender. Traditionally you would indeed have found questions like “What is your gender?” with “Male” and “Female” being the only options. It is now widely recognised that for some people the gender they identify as is not the same as the sex they were born in. As a consequence of this you will now find that sometimes questions are split, one asking for the sex and the other for gender identification. Both public and private institutions think carefully about how to ask such questions as demonstrated by the guidance of the Office for National Statistics (ONS) and by Survey Monkey.
2.1.2 Continuous data
The variable \(Y\) is said to be continuous if it can assume any value taken (more or less) from a continuum (a continuum is an interval, or range of numbers). A nice way to distinguish between a discrete and continuous variable is to consider the possibility of listing possible values. It is theoretically impossible to even begin listing all possible values that a continuous variable \(Y\) could assume. However, this is not so with a discrete variable; you may not always be able to finish the list, but at least you can make a start.
For example, the birth-weight of babies is an example of a continuous variable. There is no reason why a baby should not have a birth weight of \(2500.0234\) grams, even though it wouldn’t be measured as such! Try to list all possible weights (in theory) bearing in mind that for any two weights that you write down, there will always be another possibility half way between these. We see, then, that for a continuous variable an observation is recorded, as the result of applying some measurement, but that this inevitably gives rise to a rounding (up or down) of the actual value. (No such rounding occurs when recording observations on a discrete variable.)
A variable can be continuous even though it is defined on a limited scale. For instance the weight variable has a limited scale as weights cannot be negative.
Finally, note that for a continuous variable, it is unlikely that values will be repeated frequently in the sample, unless rounding occurs.
Other examples of continuous data include: heights of people; volume of water in a reservoir; and, to a workable approximation, Government Expenditure. One could argue that the last of these is discrete (due to the finite divisibility of monetary units). However, when the amounts involved are of the order of millions of pounds, changes at the level of individual pence are hardly discernible and so it is sensible to treat the variable as continuous.
2.1.3 Additional resources
Consider if the following set of data is discrete or continuous:
The heights of your friends
The number of books on your bookcase
2.1.4 Cross-section data
Cross-section data comprises observations on a particular variable taken at a single point in time. For example: annual crime figures recorded by Police regions for the year 1999; the birth-weight of babies born, in a particular maternity unit, during the month of April 1998; initial salaries of graduates from the University of Manchester, 2012.
Note, the defining feature is that there is no natural ordering in the data you have. Say you have birth weights of babies Sarah, Lin, Max and Nikolai, then it doesn’t matter if you present that data in that order or if you re-order the data in any way, e.g. Nikola, Sarah, Max and Lin. This will be different for time-series data.
2.1.4.1 Example
Exchange Rates: From Oanda.com
Here you can see a lot of different exchange rates, all recorded at the same time. Note, however, that they are updated every 5 minutes. So you can see that whether you are dealing with cross-section or time-series data (see below) depends on your perspective.
2.1.5 Time-series data
On the other hand, time-series data are observations on a particular variable recorded over a period of time, at regular intervals. For example personal crime figures for Greater Manchester recorded annually from 1980-2012; monthly household expenditure on food; the daily closing price of a certain stock. In this case, the data does have a natural ordering since they are measured from one time period to the next.
2.1.5.1 Example
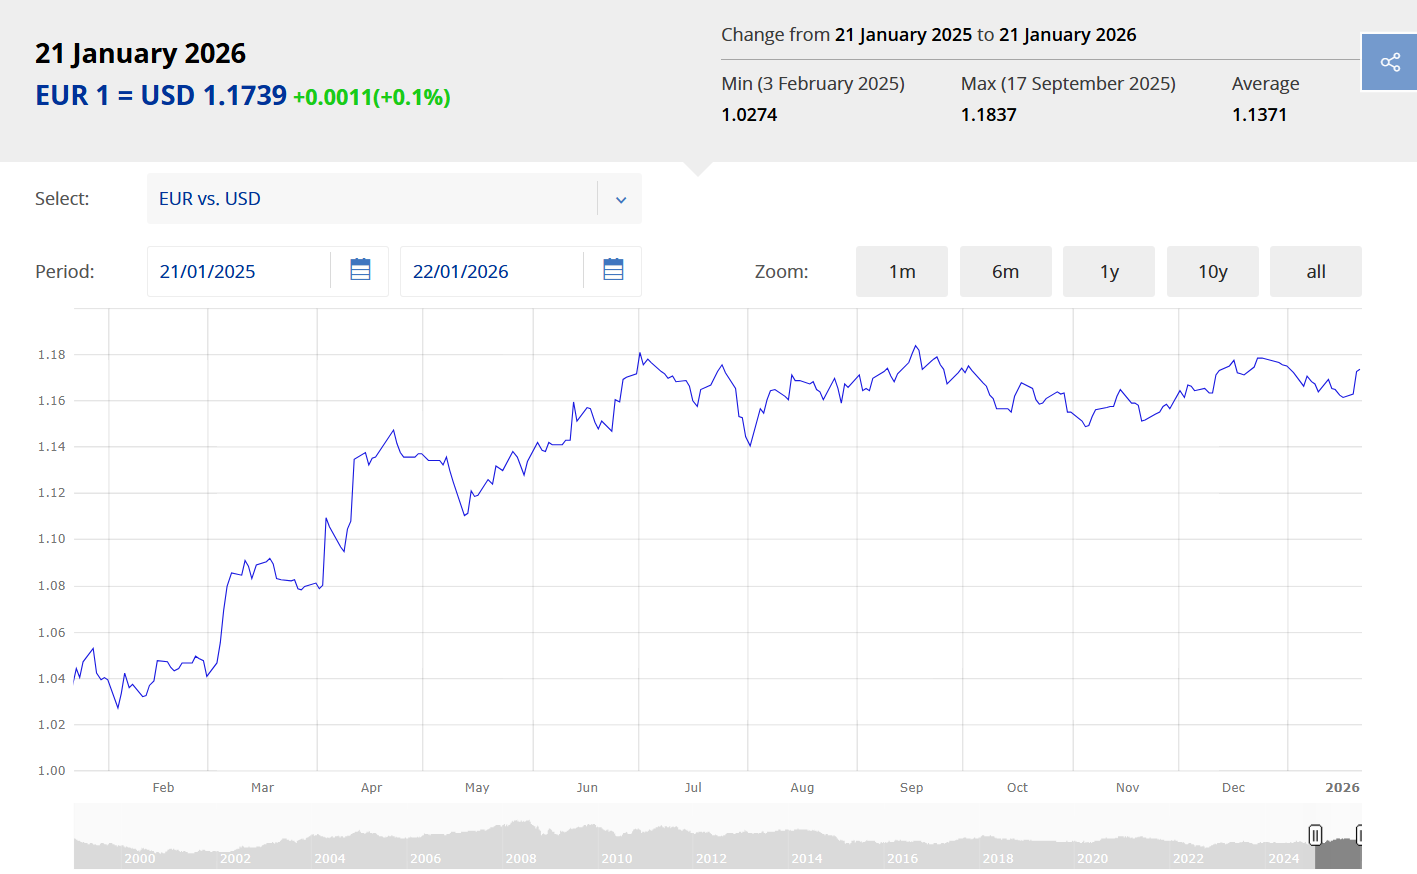
Exchange Rates: From USD v EURO exchange rate from the ECB
An example for a time-series of an exchange rate, here USD/EUR.
Consider if the following set of data is discrete or continuous:
Study hours data from students responding to a survey after the 2nd week of semester.
Temperatures at 8am on the 22 Jan 2026 from all British cities
Temperatures at 8am in Manchester for all days in 2025
2.2 Population and Sample Data
When dealing with data we will have to be aware of what the difference between population and sample data are. The population represents all the data you are interested in. Imagine you have asked all households in your postcode area for their annual income. In case you are interested in the incomes in your postcode only, then your observations represent the population data. If however, you are really interested in the average household income of ALL households in Manchester, then the data you have collected in your postcode are a sample only. As you can see, the same set of observations can be either a sample or population, it really depends on the question you are asking.
Briefly thinking about the example above where you collect all data from one postcode to be a sample for all of Manchester, it quickly becomes obvious that this would not be a good sampling strategy. If you were fortunate enough to live in a posh are (e.g. Hale Barns) it would be very obvious that the incomes you collected would not be very representative of the incomes across the whole of Manchester.
If you want a representative sample you will have to be very careful in the way you design your sampling strategy to achieve that. This is super important. Here we will not cover any more details on this and when we use survey data we will assume that the data are representative. If you are interested in this topic a good resource is: Czaja, R. and Blair, J. (2013) Designing Surveys: a guide to decisions and procedures. 3rd ed. Sage, London.
Given any particular question, we always prefer to have population data, however in most cases one will have to accept that one can only get sample data. Consider, for instance, a political analyst who is interested in the voting intentions of all eligible voters in the UK. As there are many millions voters it is virtually impossible to obtain population data. You will all be familiar with opinion polls who will be based on the basis of a sample of eligible voters (usually somewhere around 1000 voters).
The interesting question is then the following: Given the analyst is really interested in the voting intention of ALL voters, how can the sample information be used to learn something about the population? This problem is at heart of the problem of statistical inference.
Consider if the following set of data is discrete or continuous:
A safety inspector conducts air quality tests on a randomly selected group of 16 classrooms at a primary school.
The population is the entire group of people or things we want to study. The sample is the part of the population that we actually collect data from.
The safety inspector tested classrooms in the primary school, not students. Further, the safety inspector only tested classrooms in one school, not in all the schools in the district. So the safety inspector selected 16 classrooms.
The population is all classrooms in the primary school; the sample is the 16 classrooms selected.
The Director of A High School surveyed a random sample of 200 of their juniors to see how juniors at the school felt about the lunch offering at the school’s cafeteria.
2.3 Summary Data Types
In this lesson you learned that there are different data types, discrete and continuous, cross-section and time-series data. You would learn later, that different data types require the application of different tools. These may be different descriptive tools but also different probability tools.